Compensation Plan Simulator
Model direct-selling comp plan changes in real time before rolling them out
Video Walkthrough
Screenshots
1 / 9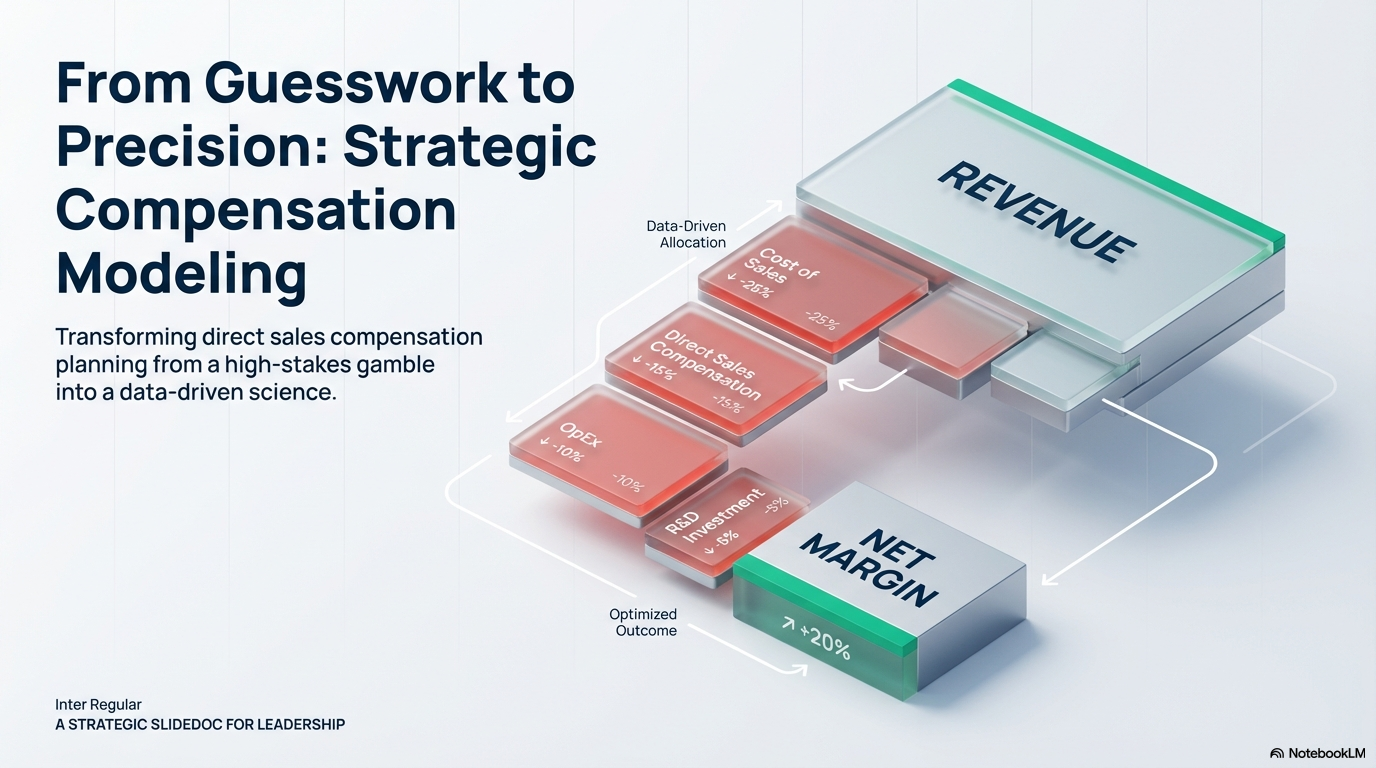
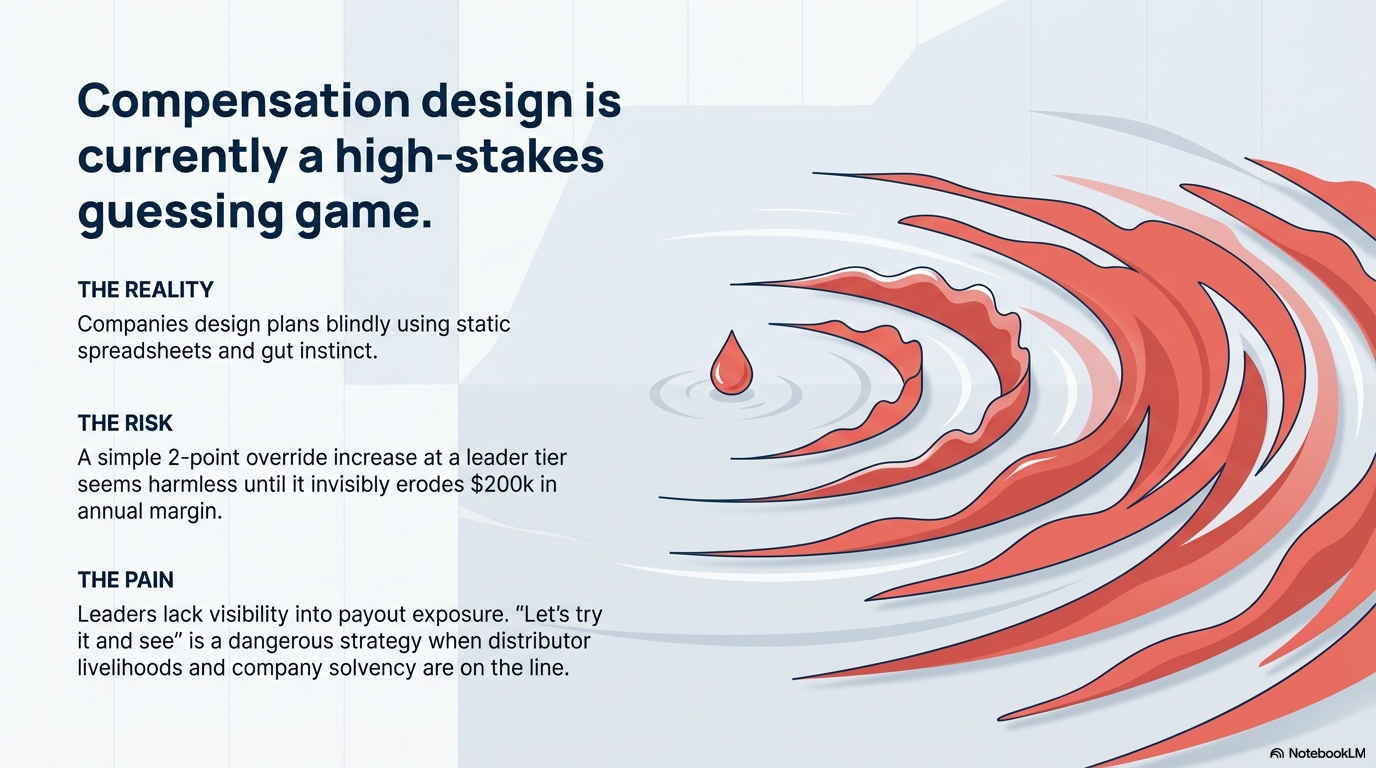
The Challenge
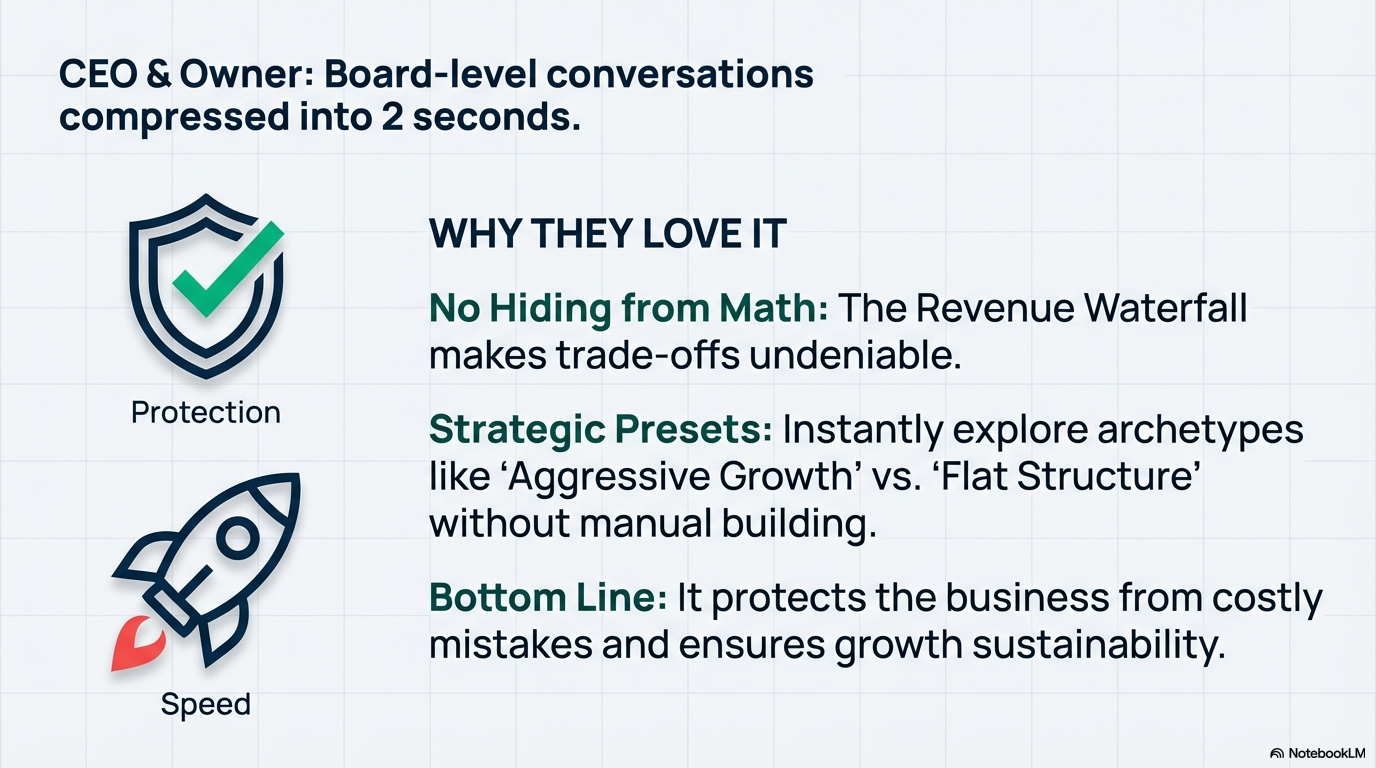
Direct-selling companies live and die by their compensation plan, yet most design changes with spreadsheets and gut instinct. A 2-point override increase at the leader tier might sound harmless until it erodes $200K in annual margin — and nobody sees the ripple effects until it's too late.
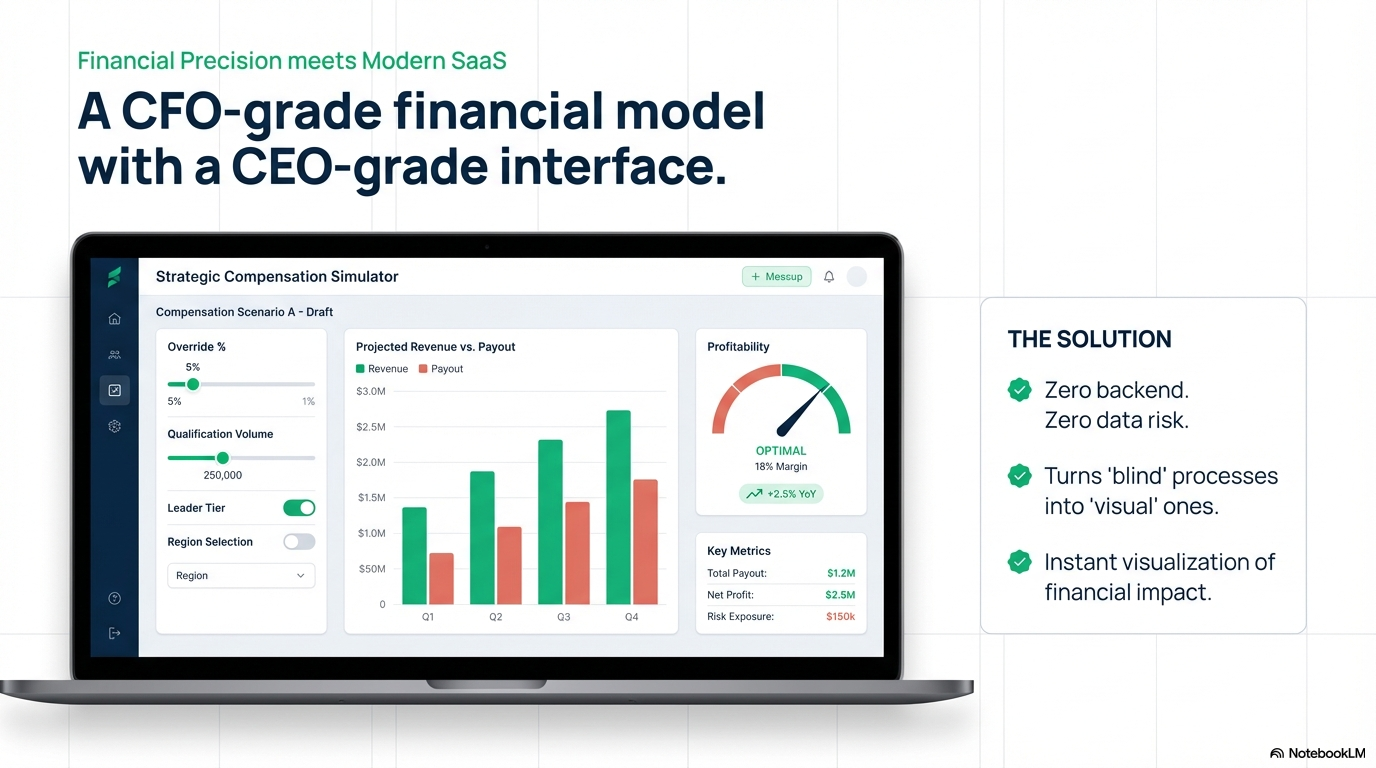
The Solution
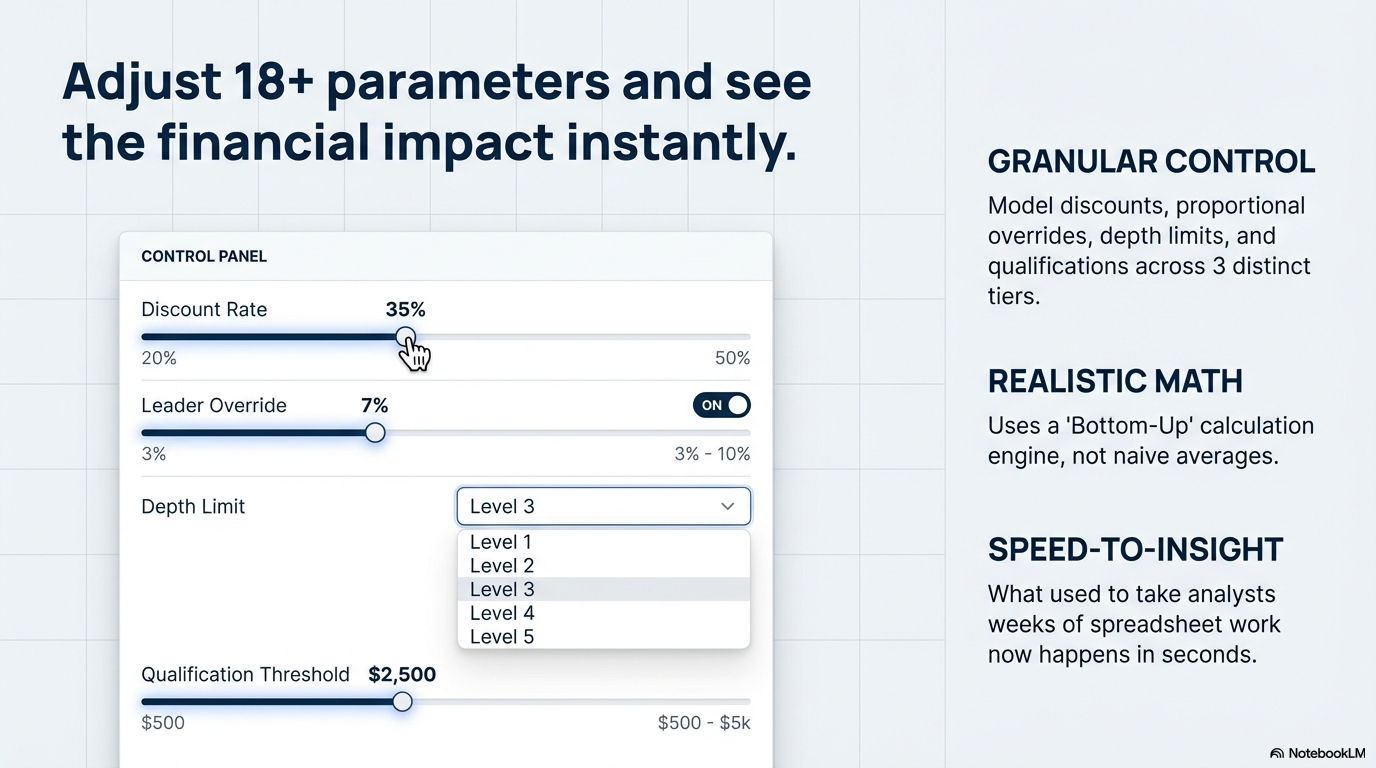
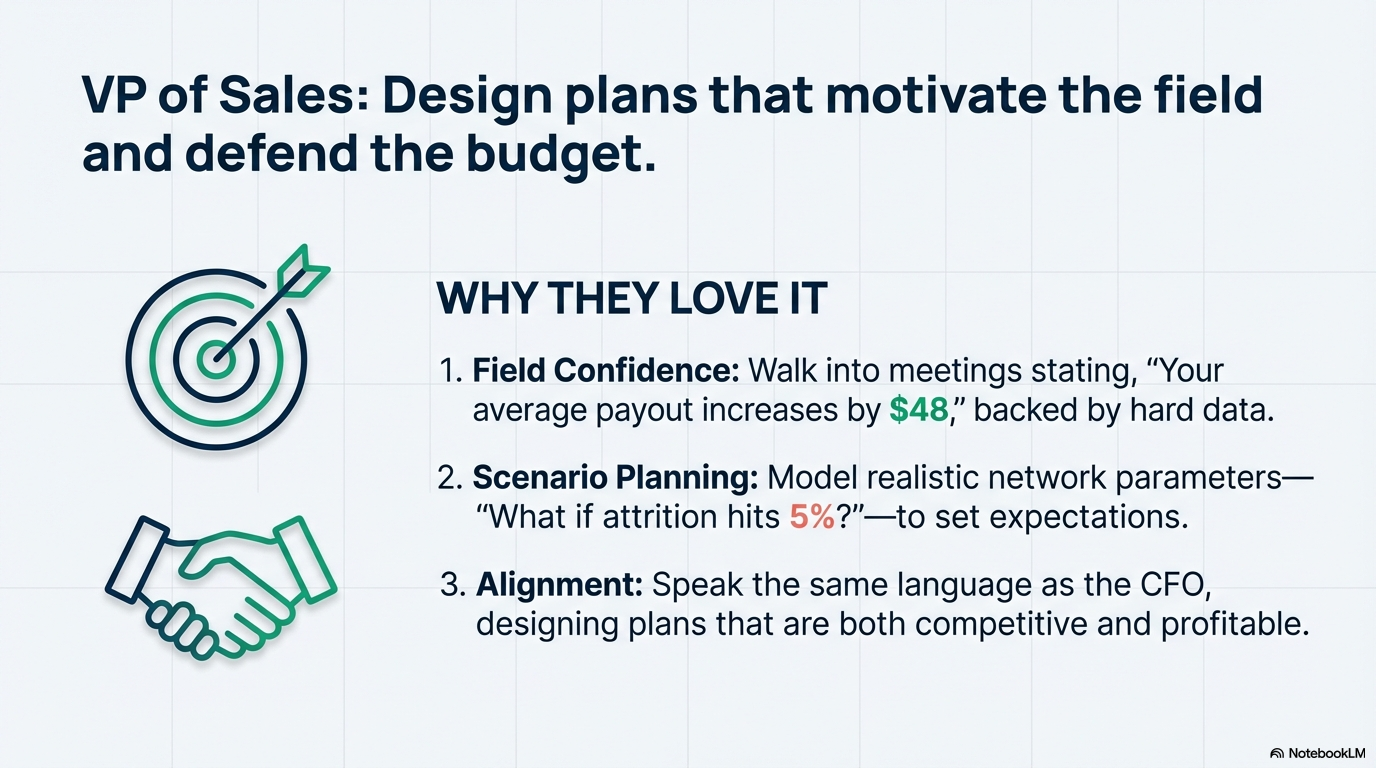
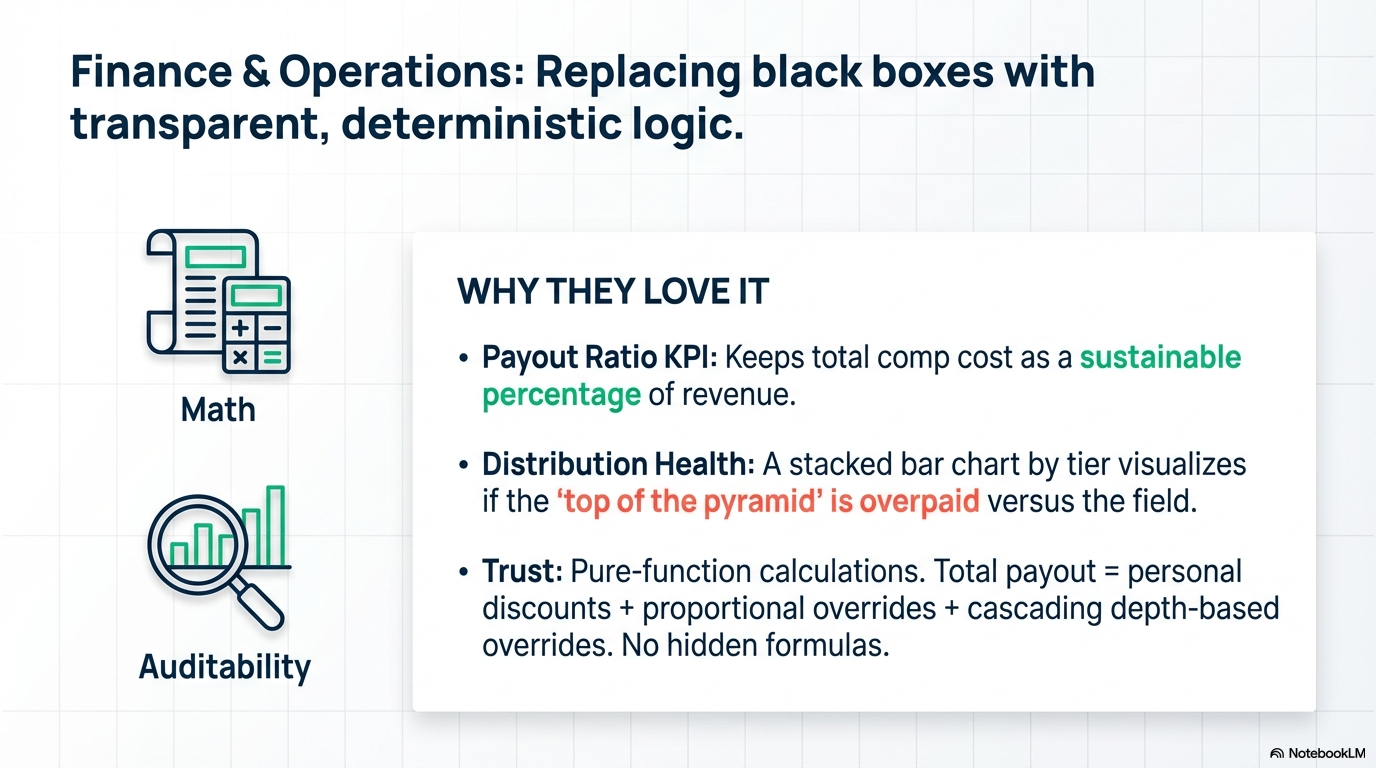
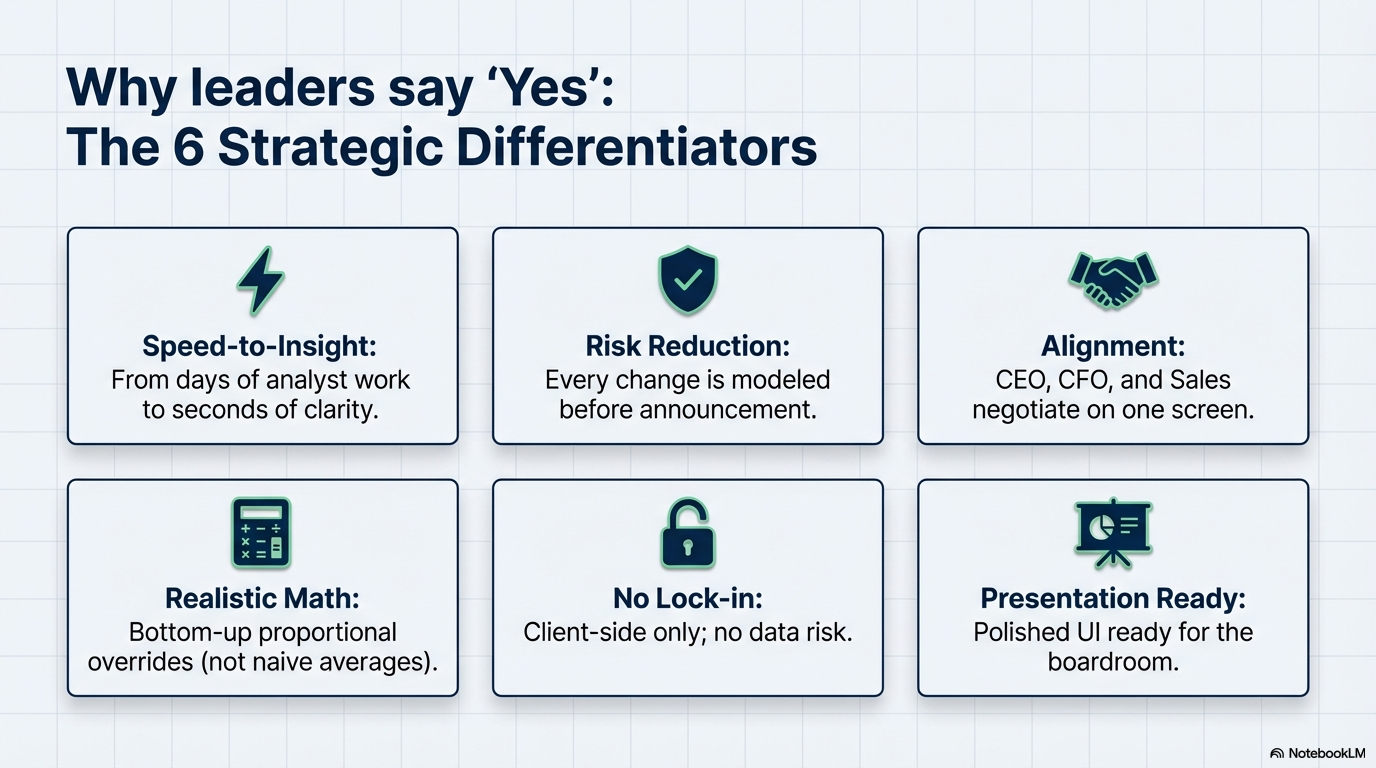
A fully interactive client-side simulator that lets operations leaders configure two compensation plans side-by-side across 45 inputs and see instant financial impact via KPI dashboards, revenue waterfalls, payout distributions, and break-even curves — all shareable via URL with zero backend.
Key Features
- 45 interactive inputs (18 per plan x 2 + 9 network params) with real-time financial recalculation
- Side-by-side Current vs Proposed comparison with 6 KPIs, dollar deltas, and percentage deltas
- Revenue waterfall, payout distribution, and break-even crossover charts via Recharts
- Shareable URL state encoding — full scenario compressed into a link for team review
- Full EN/ES bilingual support with dark/light themes and 4 built-in scenario presets
Results
- 45 interactive inputs with sub-second recalculation
- 4 chart types: waterfall, stacked bar, line with crossover, comparison table
- Full state shareable via URL — zero backend, zero data exposure
Have a similar challenge?
Let's talk about how a solution like this could work for your team. Free call, no pitch.
Book a Free Call